Usage
Search Page
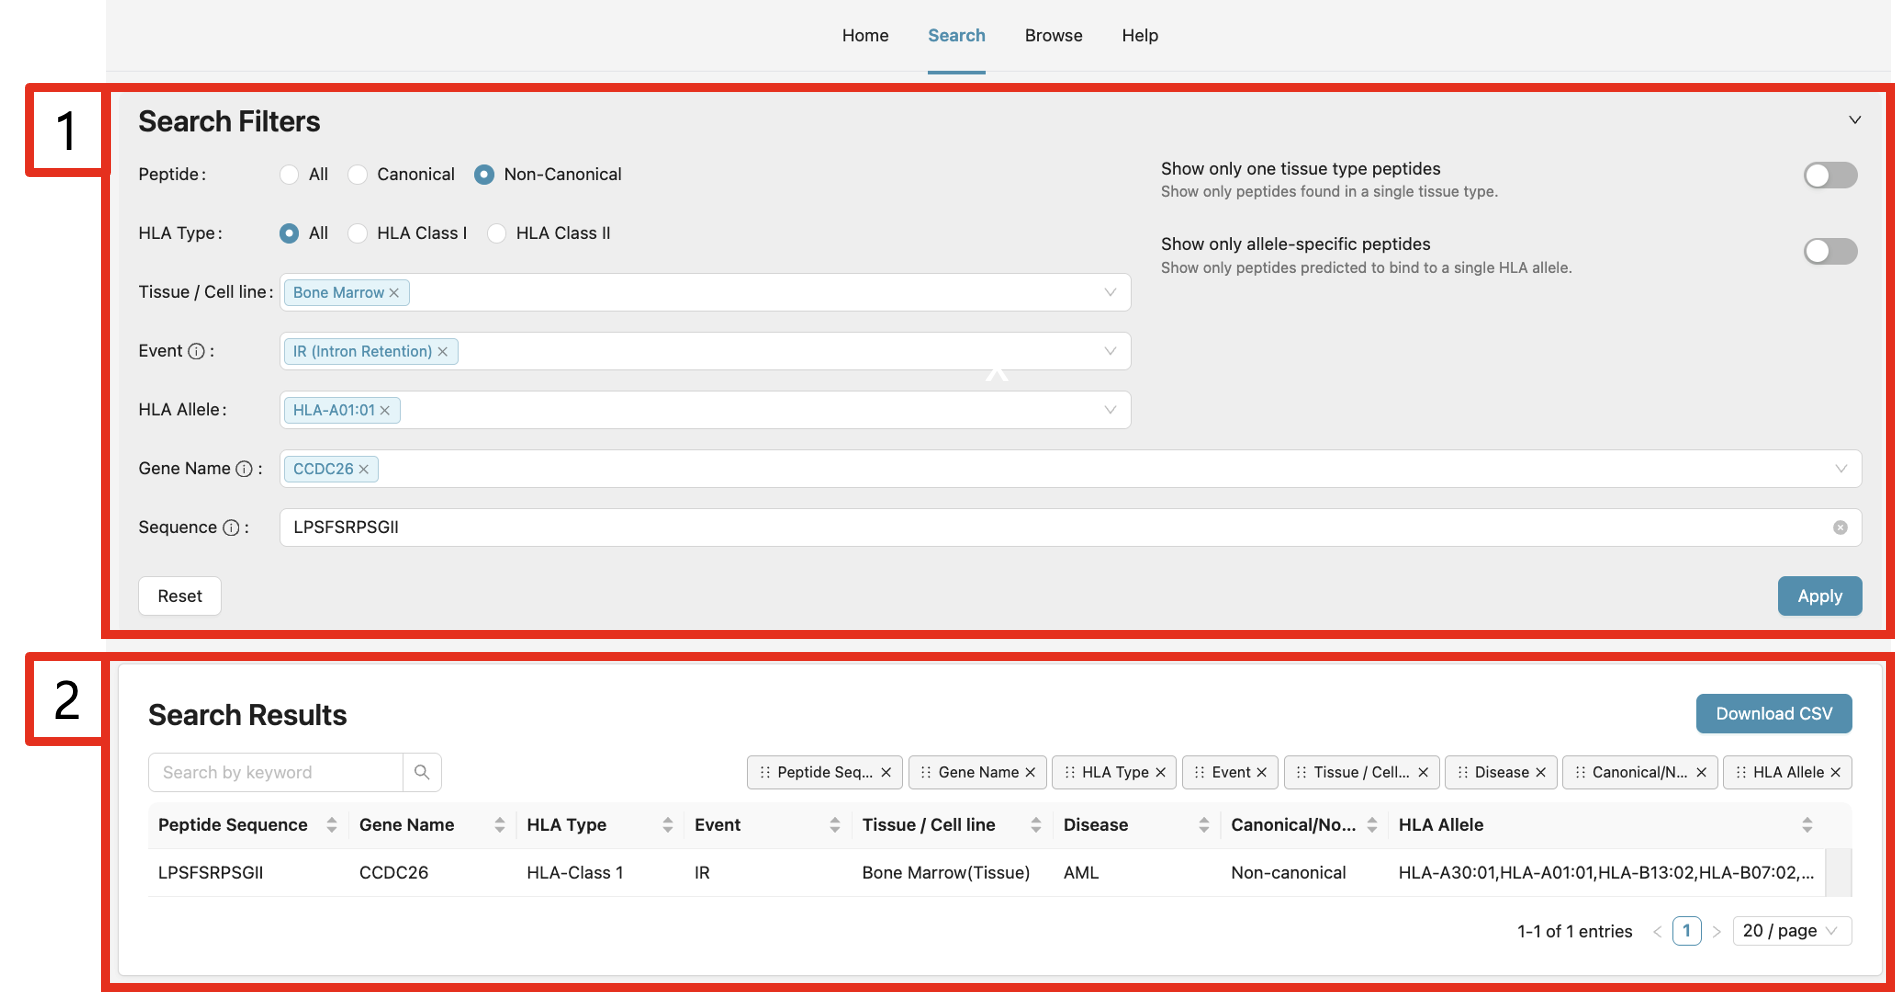
1) Search Filters
Use the Search Filters to query peptides by Canonical / Non-Canonical, HLA Type, Genomic Event, HLA Allele, Gene Name, and Peptide Sequence. Click Apply (bottom-right) to run, and Reset (bottom-left) to clear all filters.
2) Search Results
The Search Results panel shows peptides matching your filters. Use Download CSV to export the current list to your computer.
| Peptide Sequence | Gene Name | HLA Type | Event | Tissue / Cell line | Disease | Canonical/Non-canonical | HLA Allele |
|---|---|---|---|---|---|---|---|
| IVDVKMVSGFIPLKP | A2M | HLA-Class I | PC | Ovary (Tissue) | Ovarian Cancer | Canonical | HLA-A03:01, HLA-A66:01, HLA-B07:02, HLA-B14:01, HLA-C07:02, HLA-C08:02 |
Below Download CSV, you’ll find toggle buttons to enable/disable per-column visualizations for Search Results — handy when you want to focus on specific attributes. To view PSM (Peptide-Spectrum Match) details for a peptide, click its row.
Events Tab
Event abbreviations:
- PC
- Protein Coding
- FS
- Frameshift
- ncRNA
- Noncoding RNA
- 5'-UTR
- 5' Untranslated Region
- 3'-UTR
- 3' Untranslated Region
- IR
- Intron Retention
- IGR
- Intergenic Region
- asRNA
- Antisense RNA
- AS
- Alternative Splicing
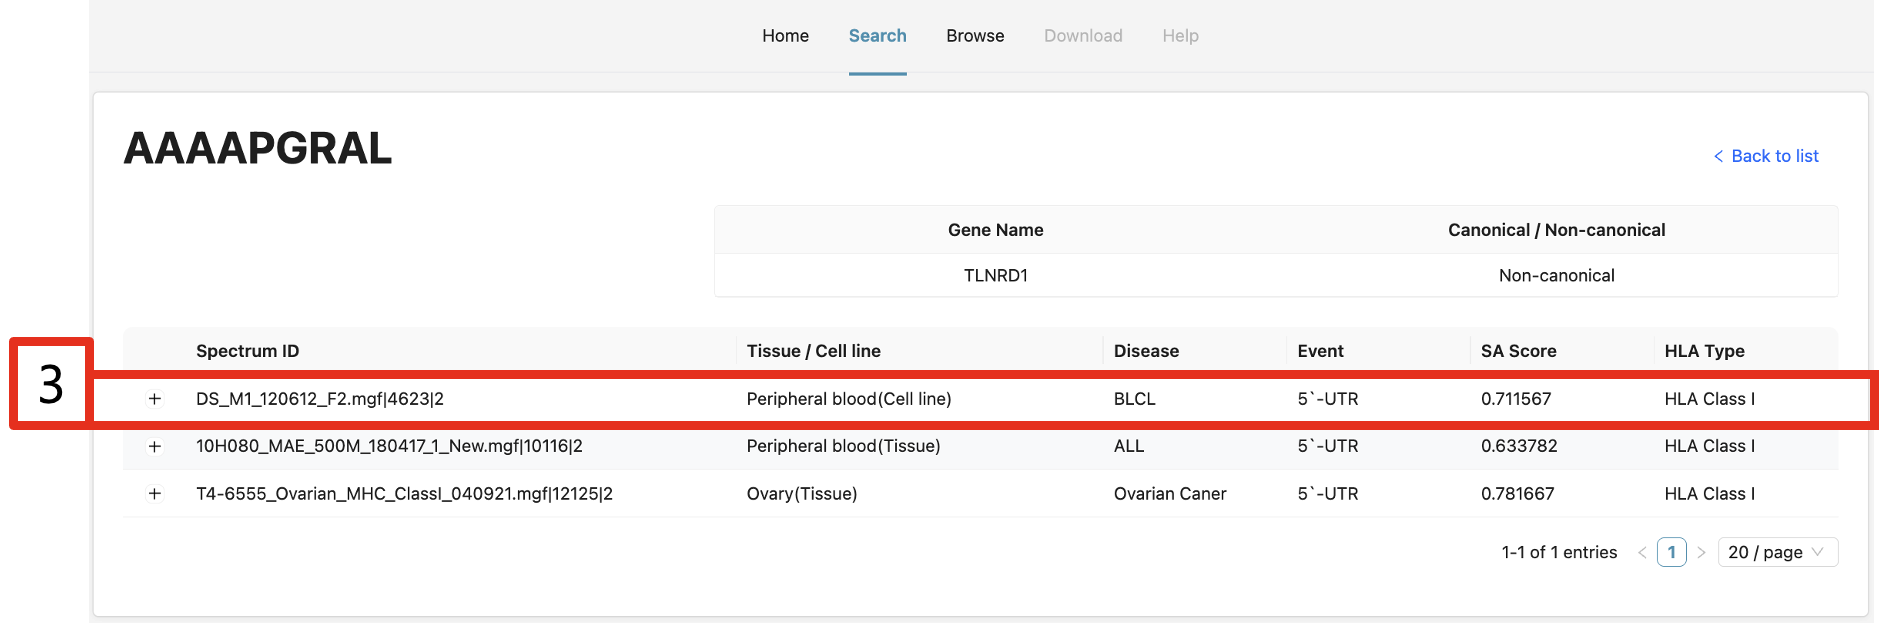
3) Navigating to Peptide Details
Clicking a peptide row opens the details page. The peptide’s PSM list is visualized; press the + button on a PSM row to expand and see more.
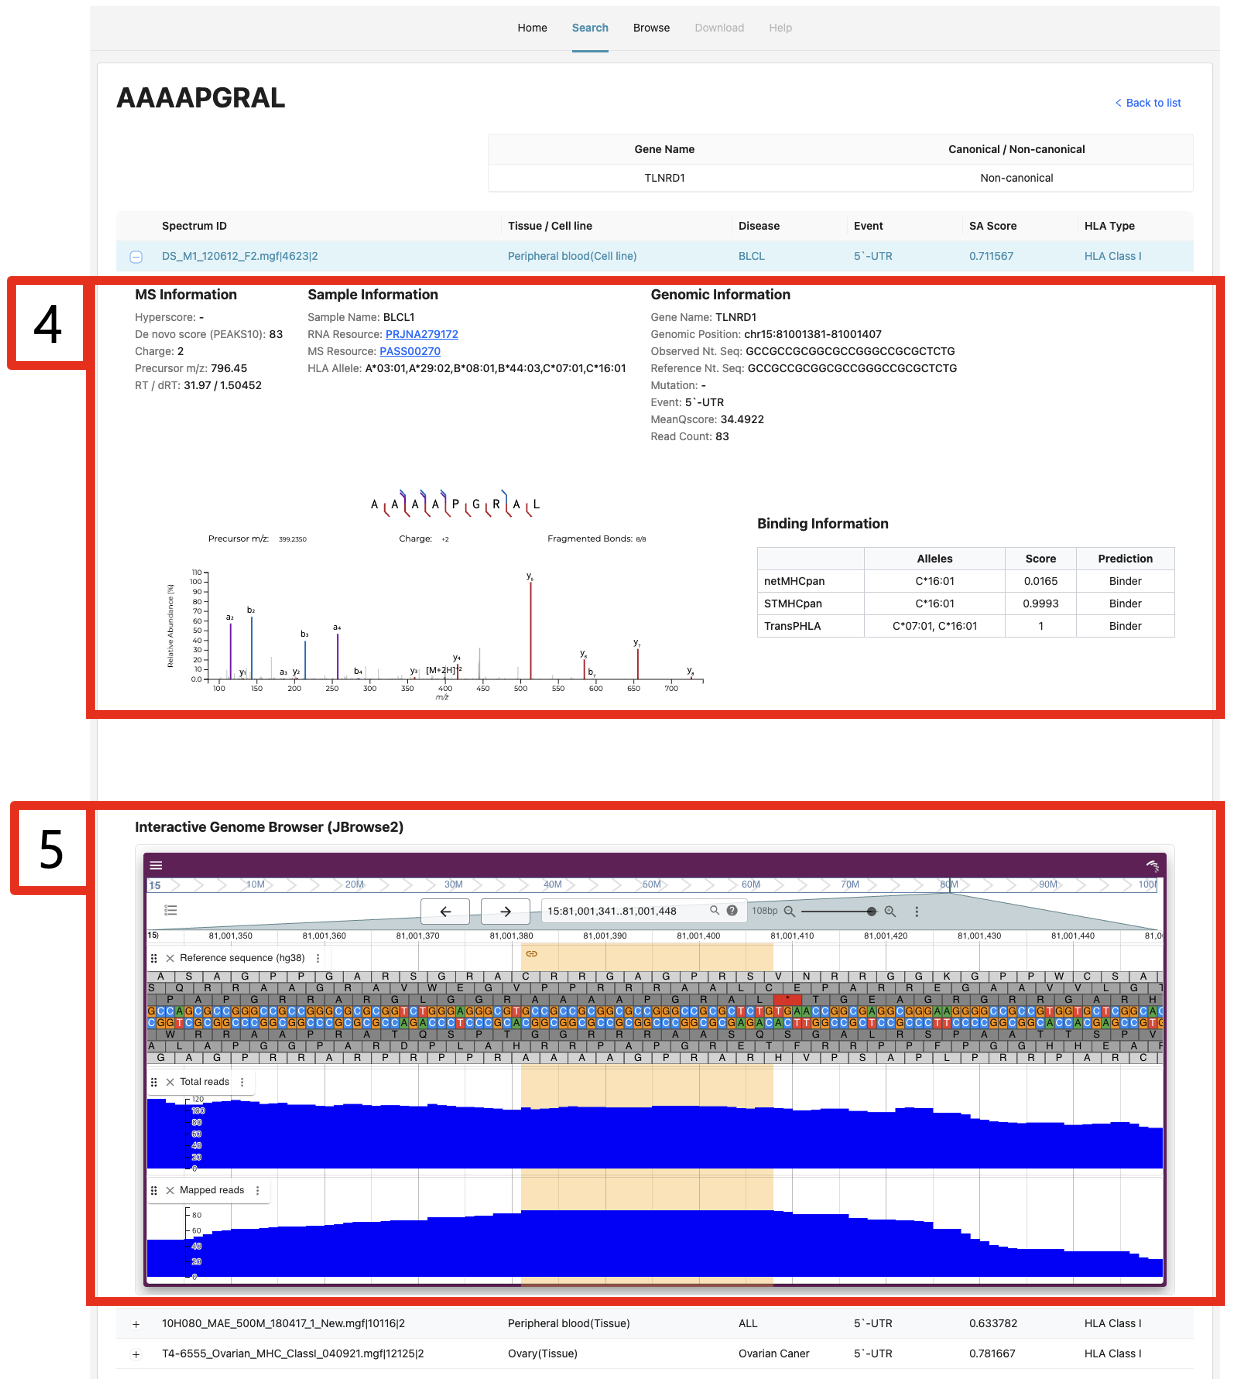
4) Details: MS / Sample / Genomic Information
The details page includes MS (spectrum), sample, and genomic information. Under Sample Information, RNA Resource and MS Resource link out to public repositories for raw files. The spectrum graph (bottom-left) visualizes the matching between the experimental and theoretical MS2 spectra for the peptide. The Binding Information panel (bottom-right) shows predicted HLA alleles and scores from three tools.
5) JBrowse Genome View
The JBrowse panel visualizes the genomic locus. The region identified by pXg is highlighted in orange. Below, Total reads (all RNA-seq alignments) and Mapped reads (reads mapped to the peptide) tracks are shown. You can pan/zoom interactively, but note that the read tracks cover only the initially loaded range.
Browse Page
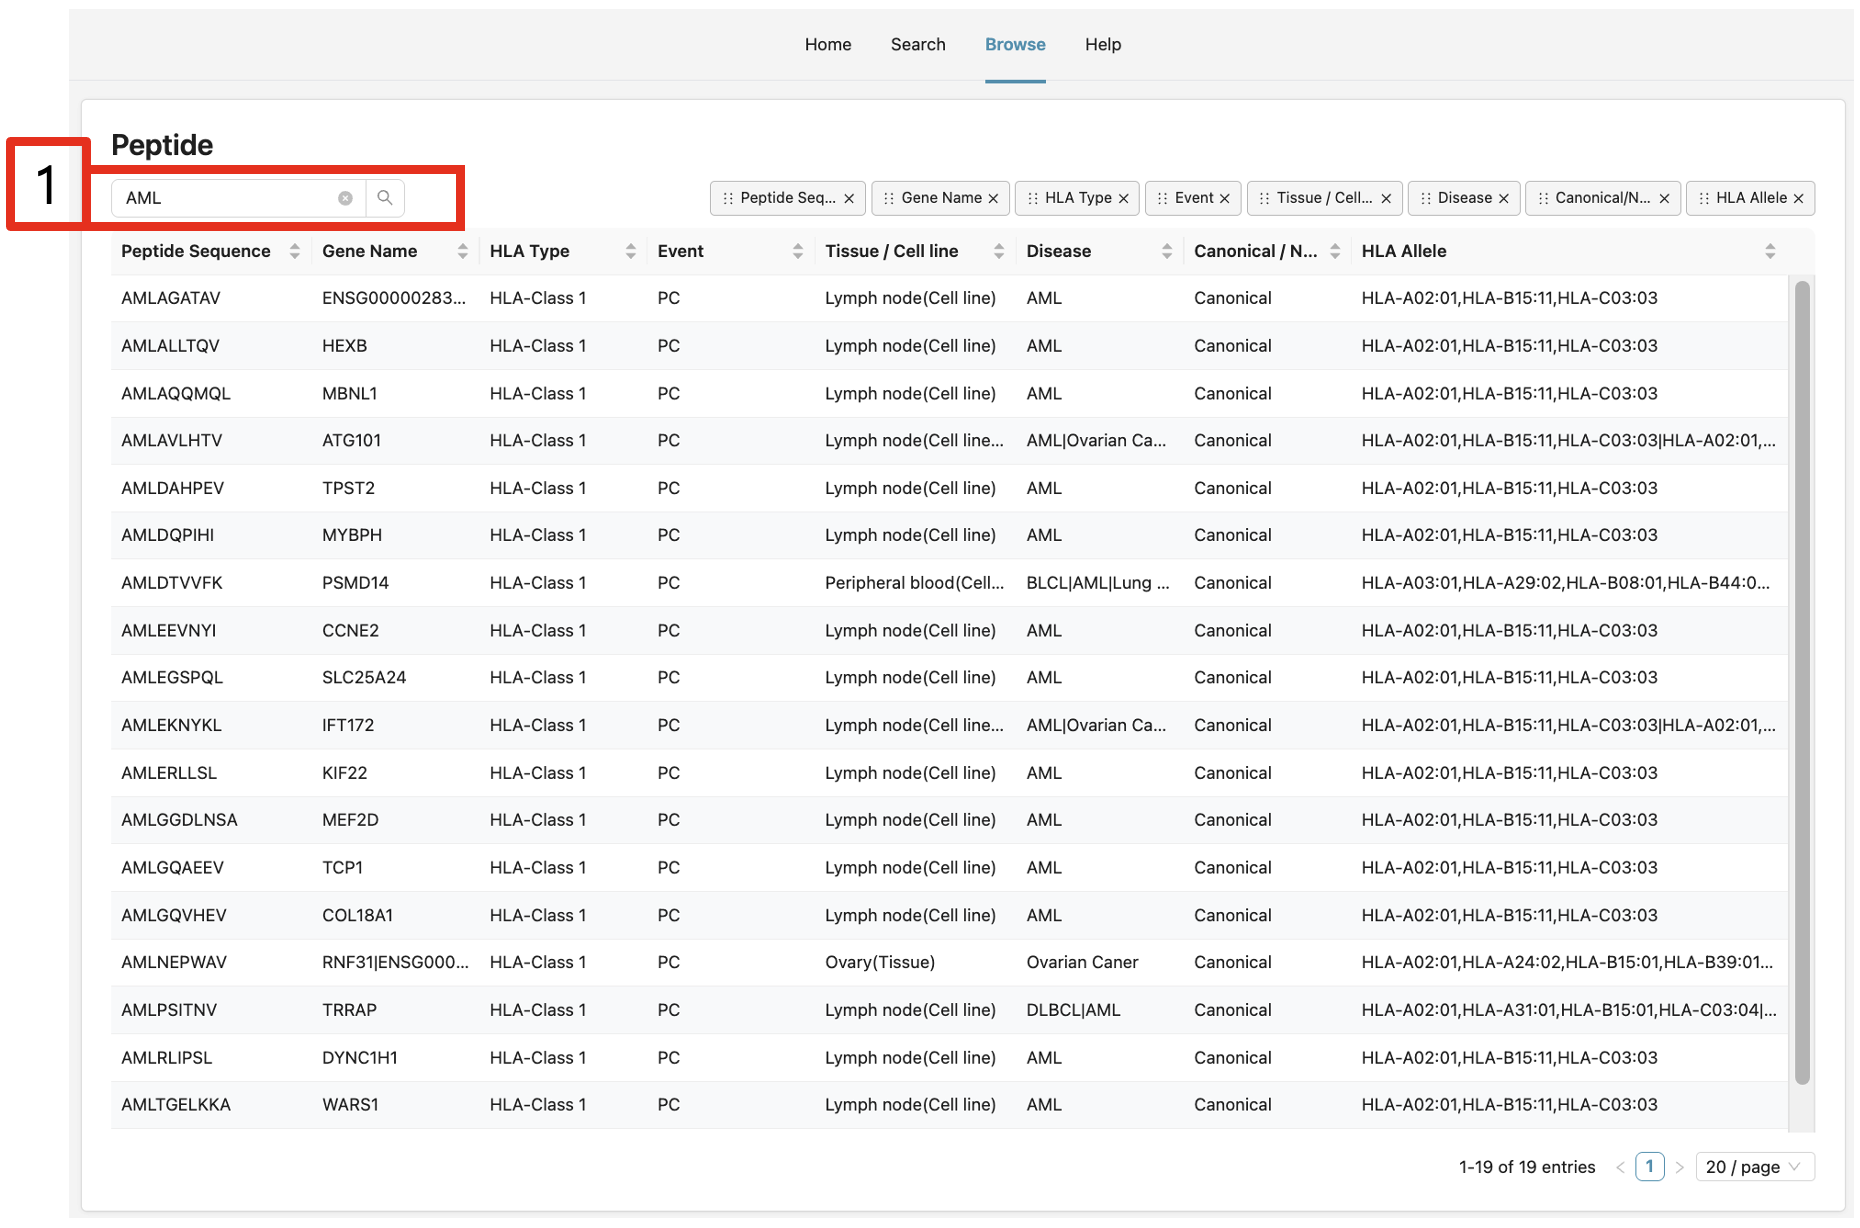
1) Quick Search & Row Navigation
In Browse, you can filter rows by typing a partial peptide sequence in the quick search box. Click a peptide row to see its PSM list and details. The subsequent steps mirror Search 3 and Search 4 above.
Contact
We strive to provide user-friendly and reliable web services. Please feel free to reach out to us: